
Figures below are taken from the vendor's public page. This is not a recommendation to buy or sell a security. Disclosure
Fidelity Go
A reader comparing Fidelity Go’s published advisory fee
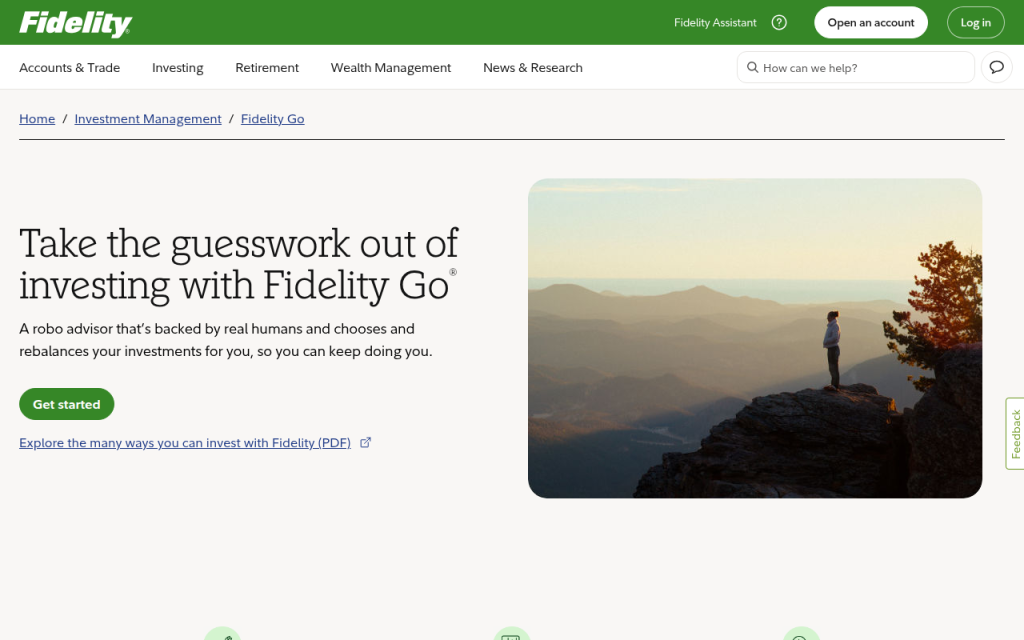
Screenshot of the company's public website, Fidelity Go.
Published terms
- No advisory fee while the account’s average daily balance stays under $25,000, per the March 30, 2026 brochure
- The product page says there are no trading, transaction, or rebalancing fees
- The 0.35% rate and the $25,000 step are printed in the brochure, not estimated here
Limits
- At $25,000 and above, 0.35% applies to the entire balance, not only the dollars above $25,000
- Accounts are not aggregated for billing
- This note did not open an account, so it does not describe a questionnaire or a funded test
Fidelity Go is Fidelity’s automated investing program, run through Strategic Advisers LLC. This page is for someone comparing its published advisory fee with other managed accounts. The image is a screenshot of the public page at https://www.fidelity.com/wealth/fidelity-go. That capture shows the Fidelity header and the heading “Take the guesswork out of investing with Fidelity Go,” plus Fidelity’s line that a robo-advisor backed by people chooses and rebalances the investments. The fee schedule is not in that hero. It is in the Form ADV Part 2A brochure dated March 30, 2026, which is the source of the dollar rates below.
The brochure’s two rates
The brochure’s advisory fee table has two rows. Average daily assets under $25,000: no advisory fee. Average daily assets of $25,000 and above: 0.35% annually. The 0.35% rate applies to the entire balance once the account is in that tier. It is not charged only on the dollars above $25,000. The brochure’s own example says that if July and August stay under $25,000 and September goes over, July and August are assessed 0.00% and September is assessed 0.35% on the whole balance for the days the account was funded.
Average daily assets are determined on the last business day of the month, and that figure sets the rate for the month. If the month ends on a weekend or holiday, the last business day’s value is used for the remaining days. The monthly amounts in a quarter are added together. The total is deducted from the account after the quarter ends. Program accounts are not combined for this bill. One account under $25,000 does not borrow the balance of another account to change its tier.
The brochure says the fee pays for ongoing discretionary management and for brokerage, clearing, and custody provided by Strategic Advisers’ affiliates. The public product page adds that there are no trading fees, transaction fees, or rebalancing fees. It also says that reaching $25,000 brings financial coaching sessions and, for taxable accounts, tax-loss harvesting. Those two features are stated on the product page. The fee table itself is the brochure’s.
If securities are sold to pay the advisory fee in a taxable account, the brochure says that sale can create a taxable gain or loss. That is a consequence of paying the fee from inside the account, not a separate Fidelity penalty listed as a line item.
Arithmetic on the published rate
These dollars are this page’s multiplication, not a Fidelity forecast. A balance of $24,000 is under the step, so the published advisory fee is $0. A balance of $25,000 is on the 0.35% row. Multiply 25,000 by 0.0035 and the annual advisory fee is $87.50, before fund expenses. A balance of $80,000 at the same rate is $280 a year, again before fund expenses: 80,000 times 0.0035. The rate applies to the whole $80,000, not to $55,000 of it. Fund and ETF expense ratios are charged inside the funds and are not included in the $87.50 or the $280.
A balance that crosses $25,000 for only one month of a quarter is not a full-quarter charge at 0.35%. The brochure’s July-to-September example is the one to use. Someone who annualizes a single month will overstate the bill.
What the screenshot is, and is not
The image is the marketing hero, not an account screen and not a fee chart drawn for this review. There is no axis and no invented balance. The mountain photograph is Fidelity’s artwork on that page. It does not show a portfolio value. The fee sentences in this review come from the brochure PDF Fidelity publishes as FGo-FPPA-ADV-2A-2B, dated March 30, 2026, and from the same product page’s pricing answers, which state the $0 tier under $25,000 and 0.35% at $25,000 and above.
No account was opened. The risk questionnaire was not completed. Coaching availability was not tested. The underlying funds and their expense ratios were not listed, because they are not in the hero and they change. Returns were not measured.
Next to the other published schedules
Schwab Intelligent Portfolios’ own page says clients pay no advisory fee and no commissions. Its brochure says the cash allocation generally runs from 6% to 30% and is swept to bank deposits, and that Schwab earns on that cash. Vanguard Digital Advisor publishes a gross advisory fee of 0.20% a year for all-index brokerage portfolios and 0.25% for an active/index mix, then reduces the gross fee by certain Vanguard revenue to a net fee it describes as approximately 0.15% for a typical all-index portfolio. Fidelity Go’s distinguishing published fact is the step: $0 under $25,000, then 0.35% on the entire balance. A person under the step is not paying the 0.35% rate. A person at $80,000 is not paying $0.
Mintcanopy does not turn that comparison into a score. The three programs use different units. A zero advisory fee with a large cash sleeve is not the same product as a 0.35% advisory fee with no such published sleeve, and neither number includes every fund expense. The brochure date and the product URL are the check. If Fidelity revises the table, the March 30, 2026 rows stop being the current price even if this paragraph is still on the site. The product page to reopen is the same URL in the screenshot, fidelity.com/wealth/fidelity-go, and the brochure file name on Fidelity’s site is FGo-FPPA-ADV-2A-2B. A coaching session or a tax-loss-harvesting trade is described there as something that starts at the $25,000 tier. This note does not describe what either one looks like inside an account, because no account was opened.